USA Maps - Professional Cartographic Satellite Imagery and Vector Maps

|
|
|

|
|
USA Satellite Images and Vector Map package
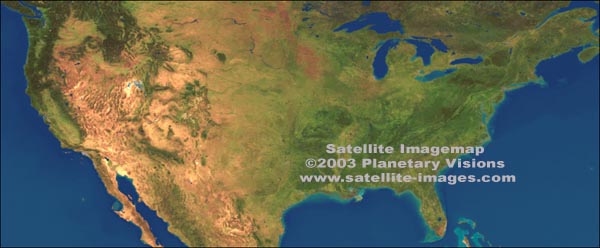
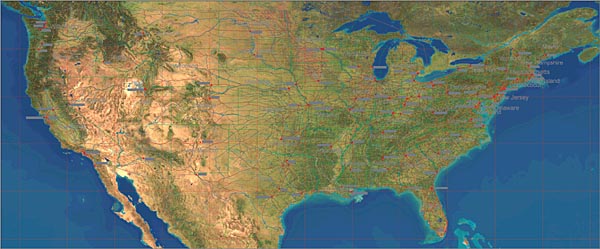
This package includes a very large USA Satellite image at 1,000 meter resolution showing land relief sized at 7,560 x 3,120 pixels, giving a printed size of 50 x 21 inches at 150 dpi, or 25 x 10 at 300 dpi. The area covered by the satellite image map runs from 24º North to 50º North, and from 64º West to 127º West. The satellite image map can be used with the Illustrator EPS vector map shown below to build a composite USA map with geo-political features. The bottom layer of the Illustrator layers palette is used to place the artwork, and the transparency may be adjusted to screen down the background satellite image texture. Any Illustrator layer may be selected, edited for color and thickness or removed to build a map view to your specification.
|
|
|
|
Although originally designed to track cloud patterns, weather satellites observe the Earth's surface
through gaps in the cloud cover on a daily basis. Receiving stations around the world regularly
process such data to give information on the strength of vegetation or the temperature of the ocean.
Planetary Visions has combined data from several of these satellite systems to construct a photorealistic
view of the Earth's surface which is readily understood. Areas of forest, mountain, desert and ocean
are clearly recognised in their natural colours, offering an alternative to traditional topographic
and political maps.

 The Mississippi Delta at a 1 km resolution. The Mississippi Delta at a 1 km resolution.
The satellite systems used offer frequent global coverage, but do not acquire images in true colour.
To simulate natural colours over the land, red and near-infrared wavelengths are used to differentiate
land cover types on the basis of their spectral reflectance characteristics. Ground-level, aerial and
orbital photography are then used to assign red, green and blue colour values to known feature types,
giving realistic land surface colour for anywhere in the world.
Ocean colour is derived from a combination of ocean depth and ocean chlorophyll observations.
Polar areas covered by sea ice are derived from individual optical images. On land, the courses of rivers
are merged in from a digital map database and the appearence of physical features has been enhanced by
hill-shading using a digital terrain model.
To minimise cloud-cover over the land, it was necessary to process a full year of satellite
observations - over 30 gigabytes of input data. Software was written to select the most cloud-free
parts from many overlapping images. So far, two man-years of effort have been spent on the
Satellite Imagemap and it is continually being improved as new data becomes available.
The Satellite Imagemap is held in a geographical coordinate system based on a latitude-longitude
grid for easy combination with ancillary data layers, e.g. digital terrain, water and political
masks, nighttime imagery. Linework such as coastlines, borders, rivers, roads and railways may be
directly overlaid without registration errors.
|
|

|

|
|
|
Return to USA Maps Intro
Digital Wisdom Inc.
USA & Canada orders: 800-800-8560 - International orders: 804-443-9000
Any comments or problems with this
site? Please
let us know
- thank you!
Digital Wisdom Inc., Box 11, Tappahannock VA 22560-0011, USA
© Digital Wisdom, Inc.
|